In the field of data-driven marketing, accurately quantifying the effectiveness of advertising channels remains essential for optimizing resource allocation and maximizing return on investment. Traditional out-of-home (OOH) advertising, encompassing formats such as billboards, public transport displays, and mall signage, has historically posed measurement challenges due to the absence of individual-level tracking mechanisms prevalent in digital environments. Drawing from a pioneering experimental framework developed by Amazon researchers, this post examines how randomized geoexperimentation combined with survey-based exposure estimation can provide causal evidence of OOH impact. We adapt these insights to demonstrate their applicability in marketing agencies, emphasizing rigorous methodology, hypothesis testing, and statistical analysis to inform strategic decisions.
The Challenge of Measuring OOH Advertising Effectiveness
Out-of-home advertising operates in physical spaces where audience exposure is inherently diffuse and difficult to isolate, unlike online platforms that utilize cookies and randomized experiments for precise attribution. This gap has limited marketers’ ability to conduct controlled studies, often relying on proxies such as brand awareness surveys or aggregate multimedia models, which fail to establish causality. In response, innovative approaches like geoexperimentation—randomly assigning treatments to geographical units and comparing outcomes—offer a solution. By focusing on metro and commuter rail lines, where audience segments can be more precisely defined, this method addresses spillover effects and enables scalable measurement. For data-driven marketing agencies, understanding these challenges is crucial, as they underscore the need for methodologies that integrate randomization with granular data to derive actionable insights, ultimately enhancing campaign precision across both offline and online channels.
Detailed Methodology: Designing a Robust Geoexperiment
The experimental protocol employs a geoexperimentation framework adapted to OOH contexts, ensuring statistical validity through randomization and exposure quantification. Neighborhoods serve as the primary units of analysis, selected for their ability to isolate resident populations while minimizing cross-contamination from adjacent areas.
Experiment Design and Randomization
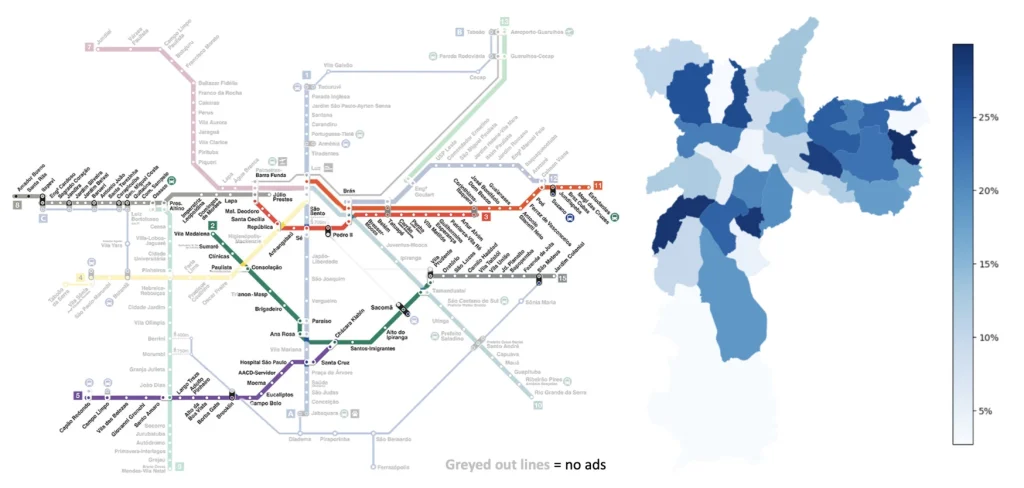
Advertisements were randomly assigned to specific metro and commuter rail lines within a target city, creating exogenous variation in exposure across neighborhoods. This randomization mitigates selection bias, ensuring that differences in outcomes can be attributed causally to the ad campaign rather than confounding factors. For instance, in a hypothetical application based on a city like São Paulo, Brazil (though the actual experiment was conducted elsewhere), lines were treated independently to generate diverse exposure levels.
Data Collection and Exposure Estimation
A key innovation involves deploying geo-targeted email surveys to residents, posing questions such as: “Which metro or commuter rail lines do you regularly use?”; “How frequently do you use these lines?”; and “In which neighborhood do you reside?” These responses facilitate the calculation of exposure fractions per neighborhood, defined as the proportion of residents reporting use of treated lines. Additional data sources include:
- Ad placement records from randomized assignments.
- Historical and campaign-period sales data, normalized to a pre-campaign baseline (e.g., indexed at 100 units for the week prior to launch).
This multilayered data approach ensures comprehensive coverage, with surveys providing the critical link between ad deployment and audience interaction.
Hypotheses and Statistical Analysis
The primary hypothesis posits that neighborhoods with higher ad exposure will exhibit statistically significant sales increases during the campaign compared to low-exposure counterparts, controlling for historical trends (H0: No difference in sales lift; H1: Positive sales lift in high-exposure areas). To test this, advanced statistical techniques are applied:
- Difference-in-Differences (DiD): This model estimates the treatment effect by comparing pre- and post-campaign sales changes between high- and low-exposure groups. The DiD estimator is given by β = (Post_Treated – Pre_Treated) – (Post_Control – Pre_Control), where β represents the causal impact, assuming parallel trends in the absence of treatment. Standard errors are clustered at the neighborhood level to account for intra-group correlation.
- Synthetic Control Methods: For robustness, counterfactual outcomes for untreated neighborhoods are constructed using weighted combinations of control units, minimizing pre-treatment differences via optimization algorithms (e.g., minimizing mean squared error in historical sales trajectories).
These analyses yield p-values to assess significance (e.g., targeting p < 0.05 for rejection of the null hypothesis) and confidence intervals to quantify effect sizes, ensuring inferences are reliable and generalizable.
By integrating these elements, the methodology provides a blueprint for marketing agencies to replicate similar experiments, adapting survey questions and randomization strategies to specific OOH formats.
Key Findings: Empirical Evidence of OOH Impact
The four-week campaign demonstrated a clear causal effect: High-exposure neighborhoods experienced a significant sales uptick, diverging from low-exposure areas during the treatment period and sustaining gains post-campaign. Sales data, normalized to a pre-campaign index of 100, revealed a statistically robust lift, validated through DiD estimates with low p-values indicating rejection of the null hypothesis. This outcome not only confirms the hypothesis but also highlights the methodology’s power in generating precise metrics without individual tracking, offering marketers empirical validation that OOH can drive measurable business outcomes.
Implications for Data-Driven Marketing Strategies
This experimental framework has transformative implications for marketing, enabling agencies to move beyond correlational analyses toward causal inference in offline channels. Practically, it supports budget optimization by quantifying ROI, audience targeting through exposure mapping, and integration with digital strategies for omnichannel campaigns. From a data science standpoint, the emphasis on randomization, survey-driven metrics, and techniques like DiD and synthetic controls exemplifies how to handle real-world complexities such as geographic spillovers. Agencies can extend this to other formats—e.g., billboards—by identifying isolation points and employing similar hypothesis testing, ultimately fostering more efficient, evidence-based decision-making.
Advancing Marketing Through Scientific Measurement
The integration of geoexperimentation with survey-based exposure estimation represents a significant leap in measuring OOH advertising impact, providing data-driven marketers with tools to establish causality and enhance performance. By rigorously testing hypotheses through detailed methodologies and statistical analyses, agencies can unlock deeper insights into campaign effectiveness. At our data-driven marketing agency, we specialize in applying such advanced experimental designs to tailor strategies that deliver quantifiable results. Contact us to discuss how we can implement these approaches for your OOH initiatives and transform your advertising efforts into precise, impactful campaigns.